The Email Health dashboard widget gives you insightful and actionable feedback to help you get your emails into your contact's inbox.
Set it up
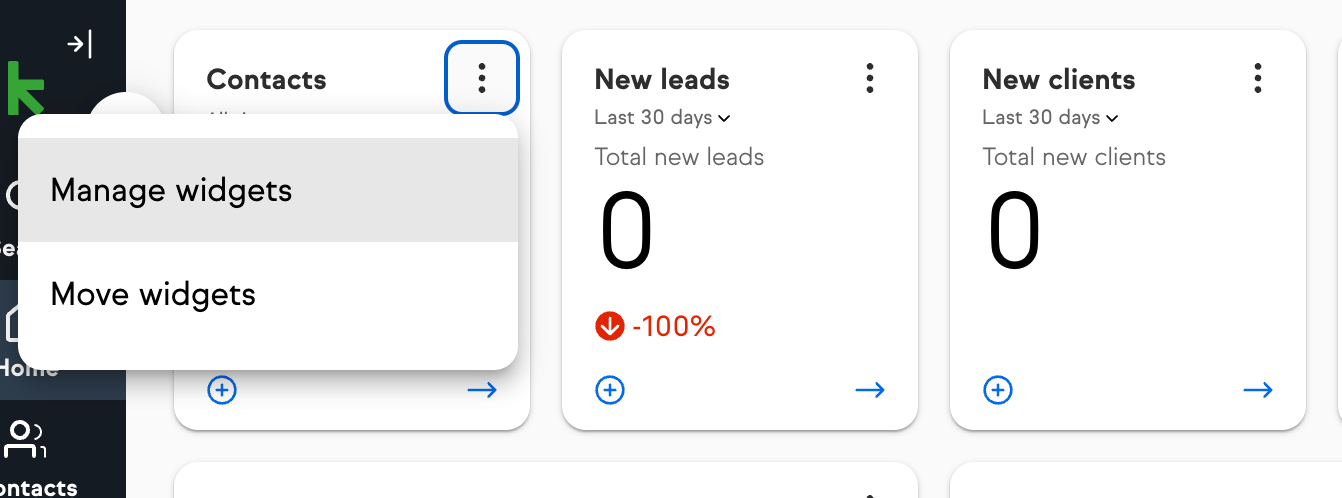
- To get started, click on the more ellipsis on any dashboard widget and click, Manage widgets
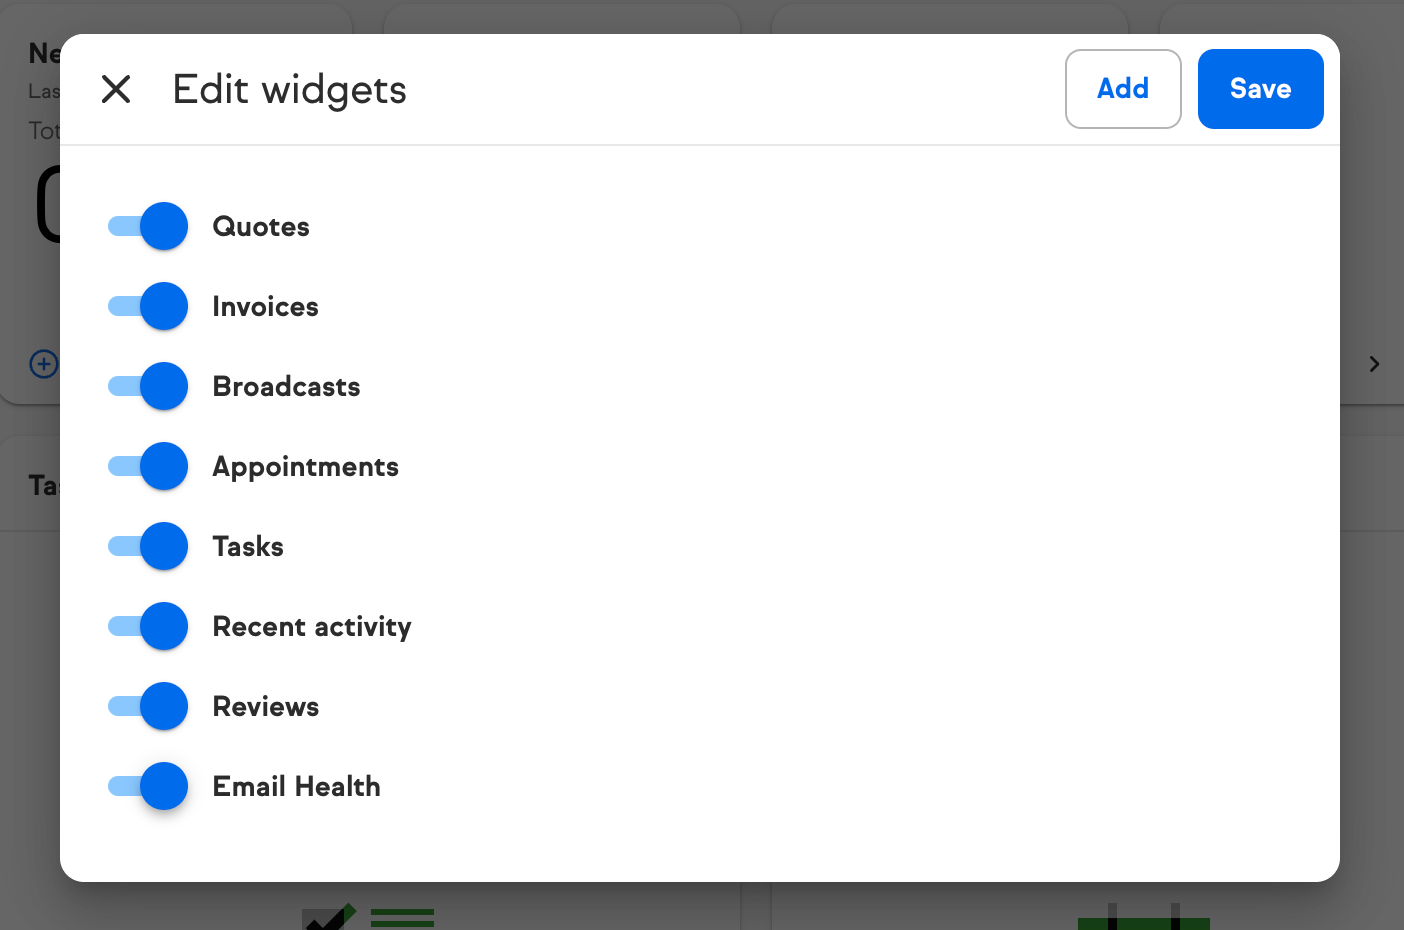
- Toggle the switch beside Email Health to activate it, ensuring it turns blue, then select Save.
- You'll now have access to these reports on your Dashboard
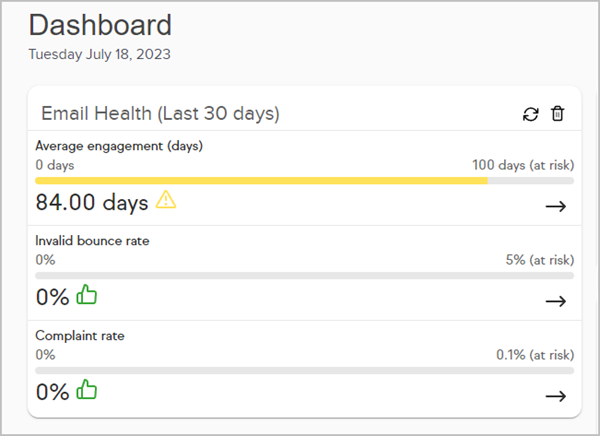
- To access each report, click on the arrow to see the details and recommended actions


Average engagement (days)
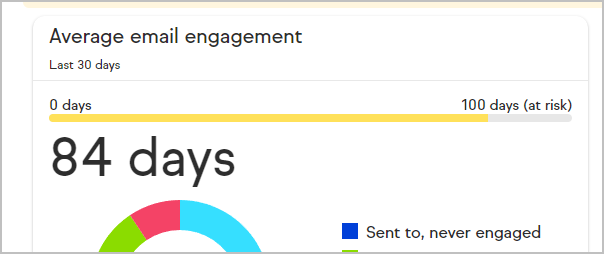
Email engagement is the time (in days) between when a customer last opens/clicks an email and when you send a new email via your Keap app.
A highly engaged contact:
- Has opened email you've sent within 30 days
- Or has clicked a link in any email you've sent within 30 days
Getting your customers to engage with your emails is important. Why? Because spam filters are getting smarter. They've mastered filtering out blatant spam and have now evolved to filter out emails that recipients aren't engaging with. Think about that: just by not engaging with your email, a recipient can land you in spam city.
Invalid bounce rate (%)
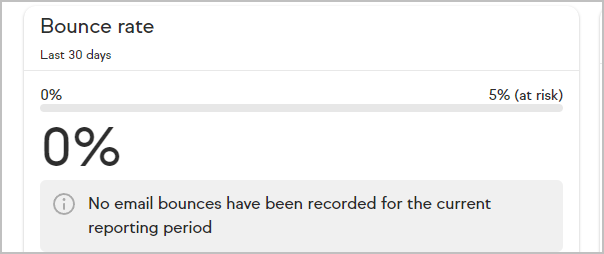
Most emails bounce because of a permanent issue with the receiving email account, a temporary issue with the receiving email account, or because the email is blocked by the receiving server.
When an email bounces, the recipient's server sends a message back to Keap that describes the reason for the bounce.
There are 6 types of bounces, General bounce, Hard bounce, Soft bounce, Main blocks, Unsubscribe requests and Undetermined.
Complaint rate (%)
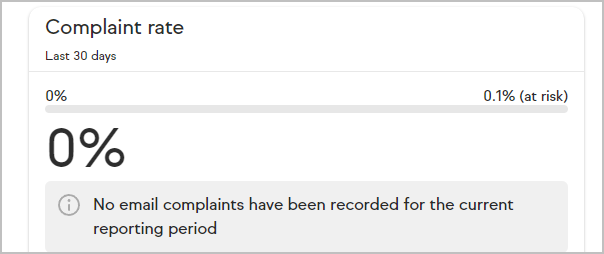
A complaint, or "spam complaint", is an email that a recipient does not want (spam is a generalized term). When it comes to the business of email marketing, a complaint is registered whenever a recipient marks an email as spam. Every email recipient is empowered to report any email to their Internet Service Providers (ISP) as spam. The ISP then informs Keap where the spam complaint came from and who sent it.
It is generally accepted in the email marketing industry that spam complaint rates over 0.1% (1 complaint per 1000 emails sent per provider) are excessive. This metric is tracked per email provider and not as global rate.
The Complaint Rate progress bar on the left shows the percentage of complaints from the provider (e.g. gmail) that has received the highest rate of reported complaints. The chart shows the breakdown of complaints by sub-category.